

What are the rhythm and metrics of planned giving? You’re focused on your organization’s planned giving program and under pressure to justify your budget, in terms of return on the dollar. And – just a hypothetical, of course – perhaps your organization has new leadership that seems especially fond of that old bromide, “what gets measured gets managed.”
The answer always seems so simple to others in the organization: just count the dollars as they are received and compare to expenditures. Of course, we know that planned giving is more subtle than that. Measuring planned giving revenue is more complicated, and we know it’s nearly impossible to correlate current fundraising activity to dollars received today. Most often, the money isn’t received until the end of one or two lifetimes. Donors don’t always inform you of their generosity in advance. Estate distributions can come as a pleasant surprise, but it’s common to discover the catalyst for the gift was an action taken by a planned giving officer decades before.
However, you can identify the patterns – the rhythm and metrics – associated with success in planned giving. Those patterns can help build a powerful case for investment in planned giving.
Key considerations include:
- What percentage of realized planned gifts were expected in advance?
- If the donor notified you of the gift, how long was it from notification to date of death?
- What was the donor’s lifetime giving pattern?
A prerequisite for these deeper analyses is a hard look at historic patterns of giving. For this, we’ll need some data. Hard data. And the more the better. Fortunately, chances are your financial accounting system can provide actual dollars received from planned gifts over the years. The gifts recorded in your donor database may not neatly tie to the receipts recorded in the financial records – they probably won’t. The donor database is a good source of information about the number of estates – a one-time event – and the financial records are an accurate report of dollars received, which might be multiple payments over a number of years. But, no matter, we’re not going to compare apples and oranges.
The Case of the Fenway School of Psychology
For the purposes of illustration, we’ve created a hypothetical organization, the Fenway School of Psychology, which is fortunate enough to have 20 years of solid data regarding realized planned gifts – that is, actual dollars received. Just to make our example more engaging, let’s say you started in your role at Fenway early in 2019, at a time when realized planned gifts seemed to be falling again. The expectation was that you would first stabilize and then rebuild the Fenway planned giving program back to its former glory. Even as you enjoyed some initial success, results for your first year were disappointing. Fortunately for you, because of the pandemic, no one paid much attention to planned giving results that year, and last year rebounded with a dramatic increase.
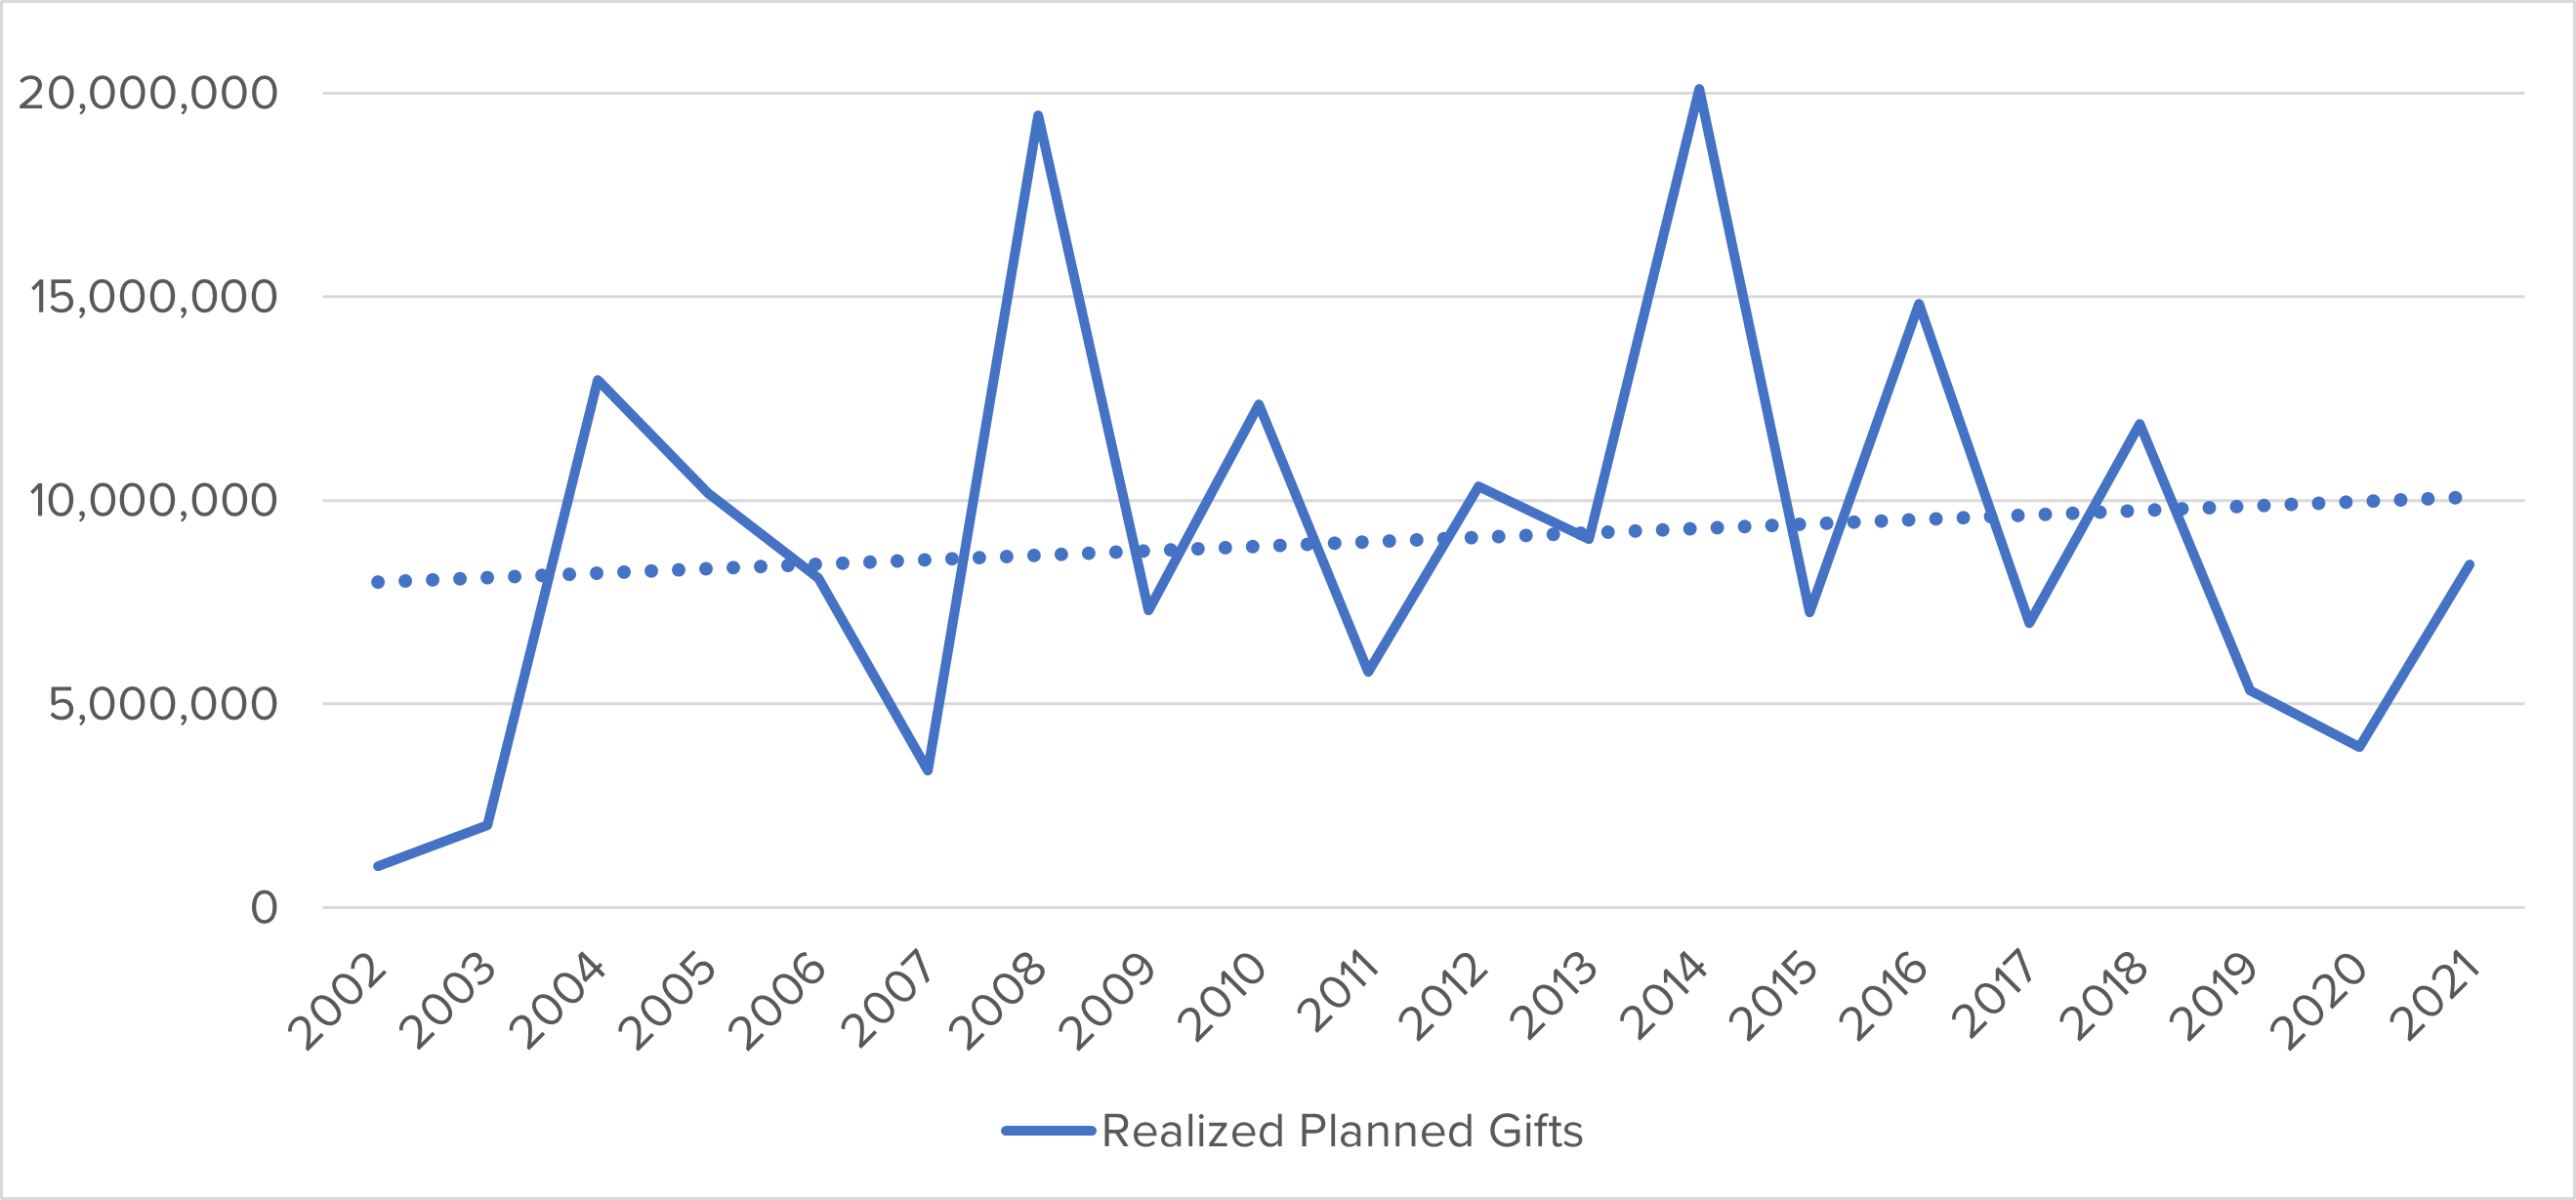
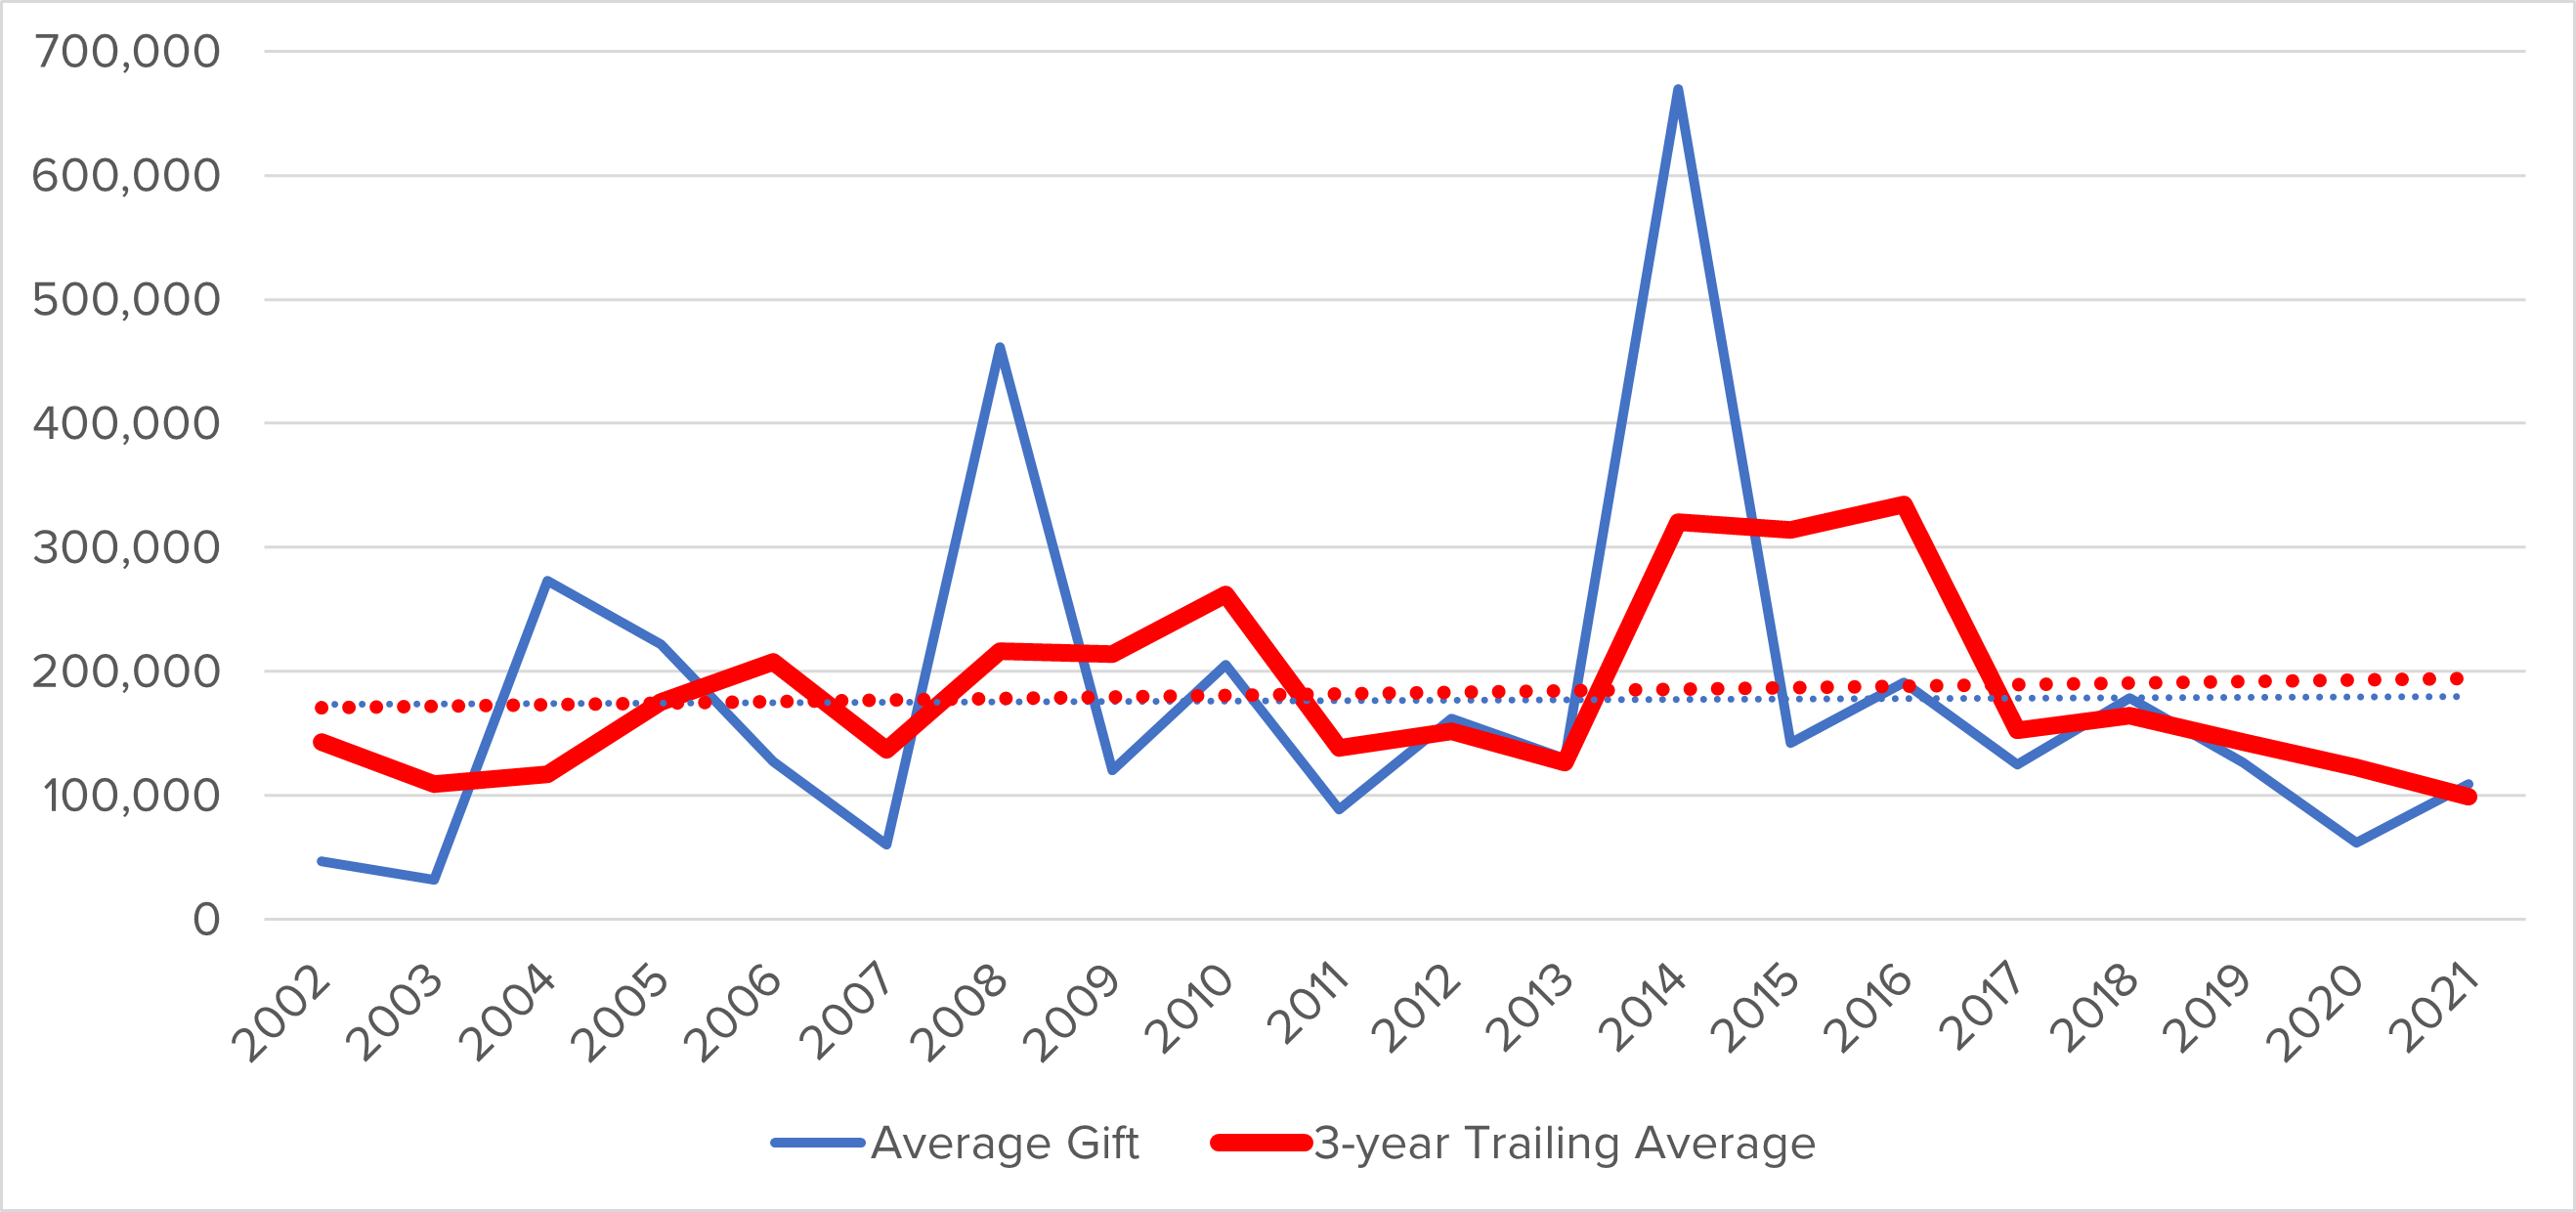
Here’s a chart showing Fenway School’s total realized planned gifts received each year as well as the number of donors, from which we’ve calculated the average gift size.
| Year | Realized Planned Gifts | Number of Donors | Average Gift |
| 2002 | 1,024,387 | 22 | 46,563 |
| 2003 | 2,012,466 | 63 | 31,820 |
| 2004 | 12,962,654 | 47 | 273,101 |
| 2005 | 10,162,877 | 46 | 221,869 |
| 2006 | 8,079,354 | 64 | 126,868 |
| 2007 | 3,367,583 | 56 | 60,536 |
| 2008 | 19,441,861 | 42 | 461,302 |
| 2009 | 7,302,426 | 61 | 120,458 |
| 2010 | 12,360,962 | 60 | 205,401 |
| 2011 | 5,783,816 | 65 | 88,981 |
| 2012 | 10,342,549 | 64 | 161,562 |
| 2013 | 9,046,693 | 70 | 129,509 |
| 2014 | 20,098,352 | 30 | 669,945 |
| 2015 | 7,256,175 | 51 | 142,524 |
| 2016 | 14,815,701 | 78 | 190,794 |
| 2017 | 6,994,198 | 56 | 124,647 |
| 2018 | 11,875,193 | 67 | 178,345 |
| 2019 | 5,322,200 | 42 | 126,539 |
| 2020 | 3,933,301 | 63 | 62,047 |
| 2021 | 8,427,630 | 77 | 109,260 |
| 20-year totals | 180,610,379 | 1,123 | 160,758 |
A simple graph can help decipher a long table of numbers. This graph shows total dollars received each year. There have been good years and not so good years. Everyone at the Fenway School of Psychology remembers the windfall bequests in 2008 (just before the Great Recession) and again in 2014. Some are wondering aloud why the past five years have been so disappointing, although the long-term trend (the dotted line) is positive, suggesting that even with year-to-year variations, Fenway’s planned giving receipts are growing over time.
Basic Statistical Measures – Average, Median, and Standard Deviation
A few basic statistics can help identify patterns in these data. Fenway School has received an average of $9.0 million each year over the past two decades. That’s a reasonable way to look at the numbers but be cautious about setting expectations for an average year! Averages can become distorted if there are a few very large or many small gifts in a year. Those windfalls in 2008 and 2014 are causing Fenway’s average to be deceptively high.
The median is the amount in the middle – half of the values are above, and half are below the median. Over the years the median total is $8.3 million, which is probably a more reliable benchmark. The median is even more meaningful when considering gift size. The 20-year average is $177,000, but the median is only $128,000.
Another useful statistical tool is the standard deviation, which is a measure of the variation around the average. Essentially, standard deviation tells us how far above or below the average two-thirds of the observations fall. For the Fenway School of Psychology, the standard deviation of the total realized planned gifts over twenty years is $5.2 million, which suggests it is reasonable to expect the total for 2022 will likely fall somewhere between $14.2 million and $3.8 million ($5.2 million above or below the average of $9.0 million). Of course, it’s not at all impossible for this year’s total to be higher or, heaven forbid, lower. Nevertheless, if you have the opportunity to manage expectations, a one-year total between $14.2 million and $3.8 million should not be too surprising.
| Year | Realized Planned Gifts | Number of Donors | Average Gift |
| Average | 9,030,519 | 56 | 176,604 |
| Median | 8,253,492 | 60 | 128,189 |
| Standard Deviation | 5,177,150 | 14 | 150,079 |
Trailing Averages
When the Fenway School of Psychology reviews its endowment payout, the investment advisors use a trailing average of past market values in order to smooth out extreme peaks or valleys. The trailing average is simply the average each year of the current year total and the pervious few years. A trailing average can provide a more realistic look at realized planned gifts for the same reason: it smooths out the extremes. Here are the graphs with three-year trailing averages superimposed.
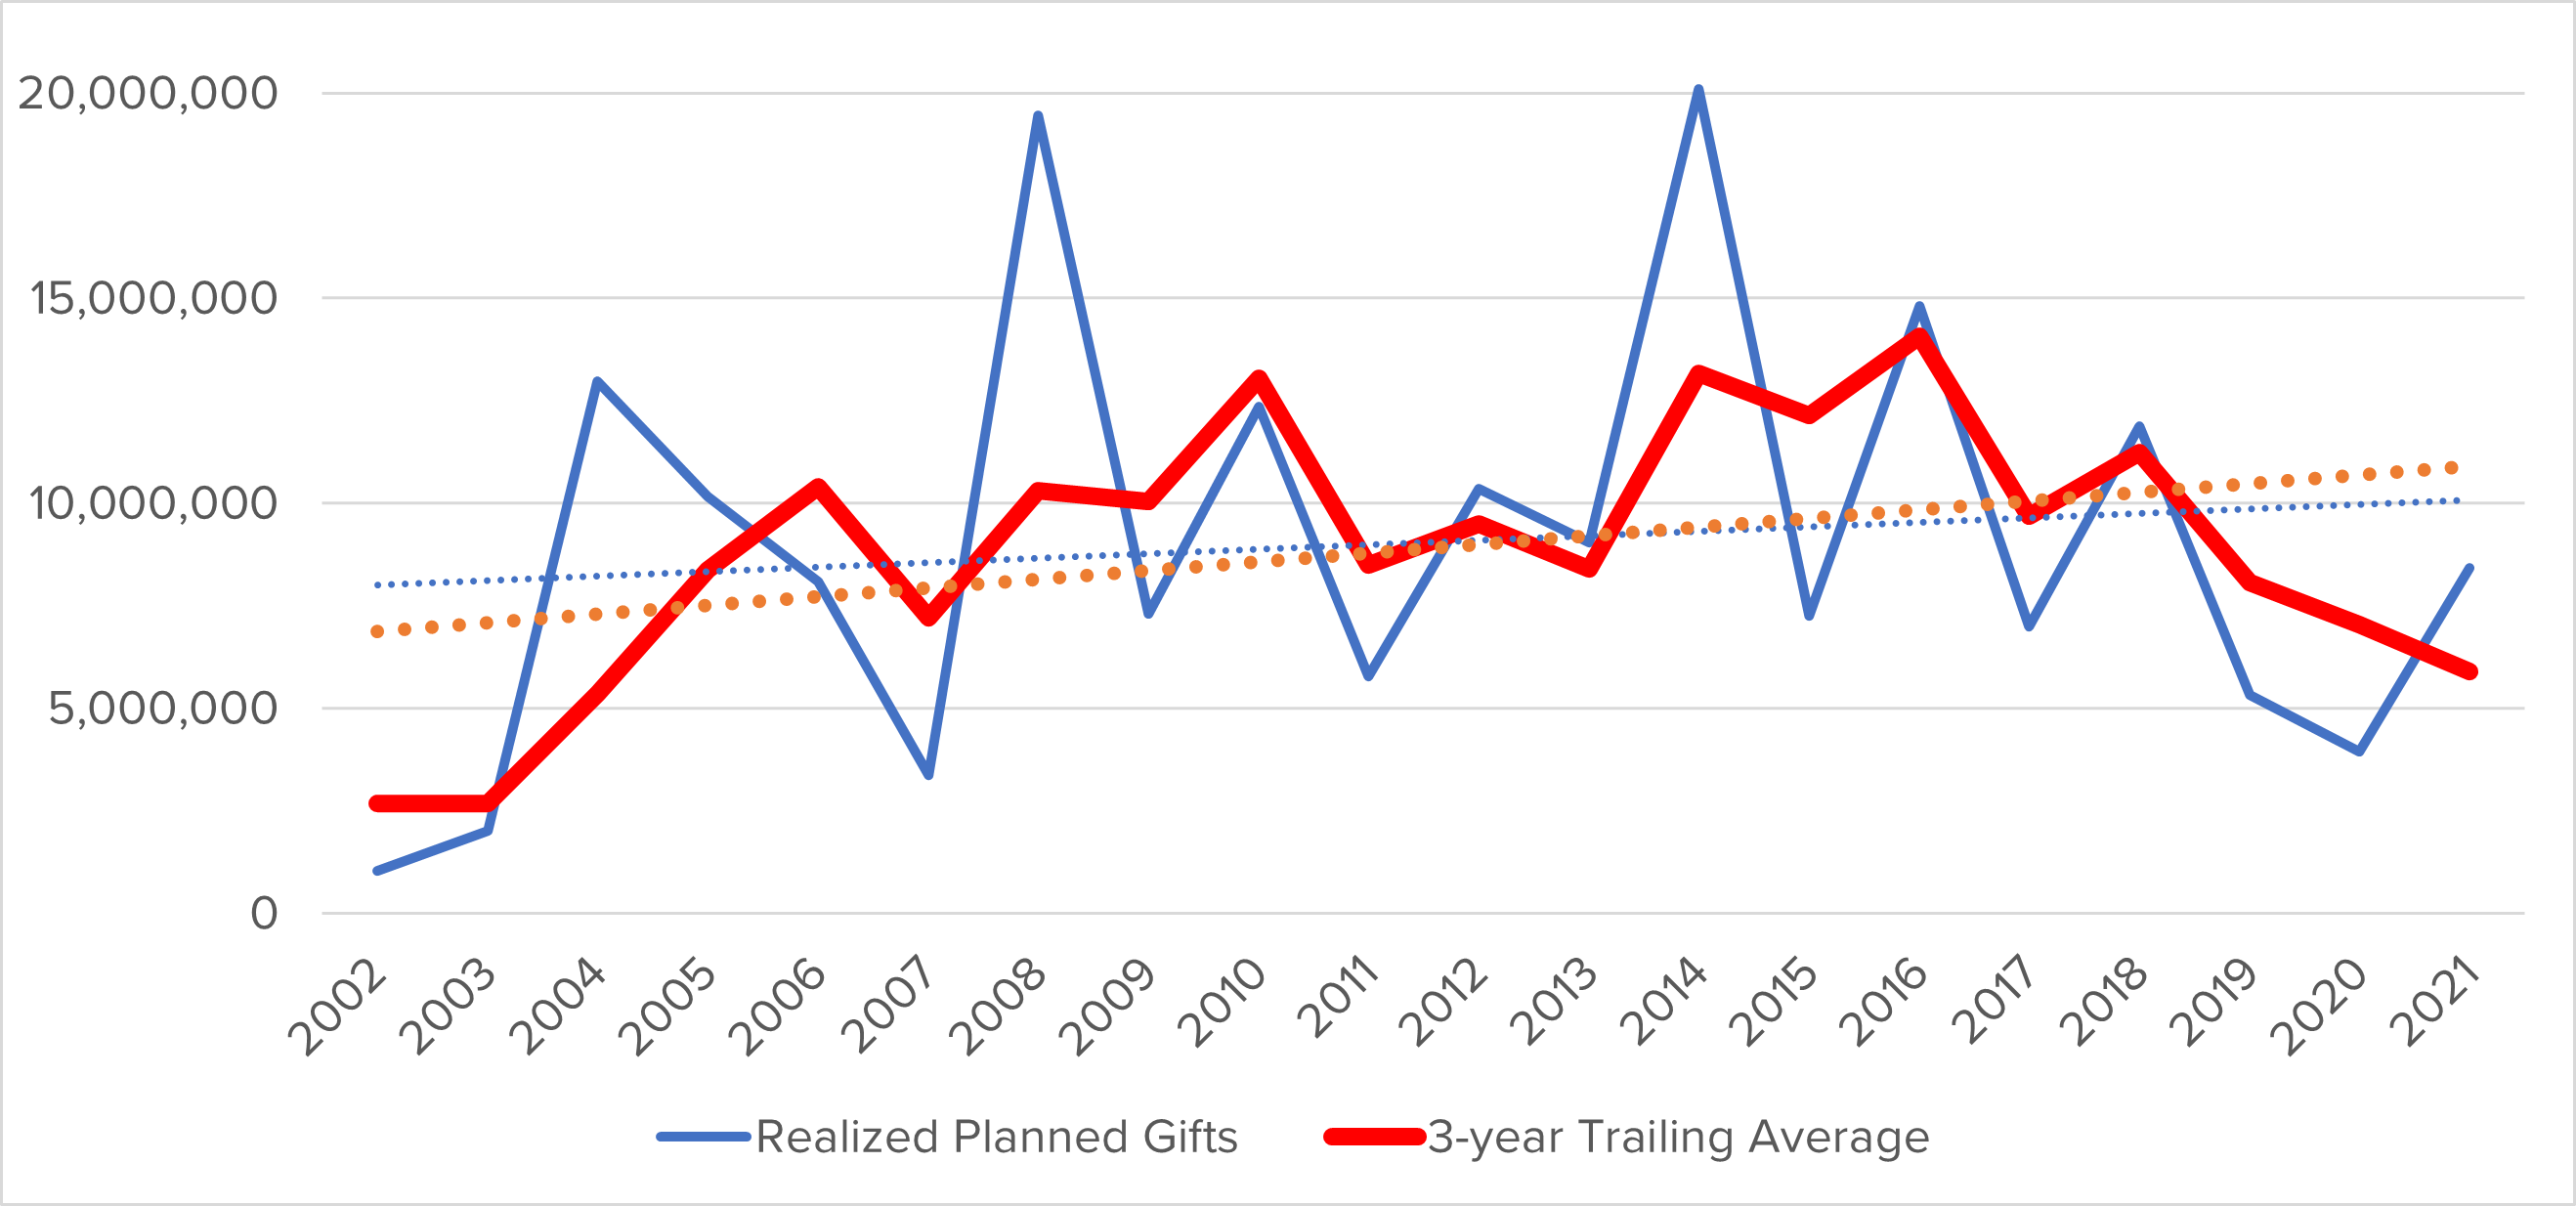
Note that the trailing averages are generally smoother, although they still show variations from year to year. Note too, dotted trend lines remain the same. Also, whether you see it as an opportunity or bad news, the trend over the past five years has been downward. You’ve got your work cut out for you!
Bequests, Bequests, Bequests
Planned gifts come in many forms, some complex and some straightforward. The pie chart shows the breakdown of Fenway School’s realized planned gifts by type of gift.
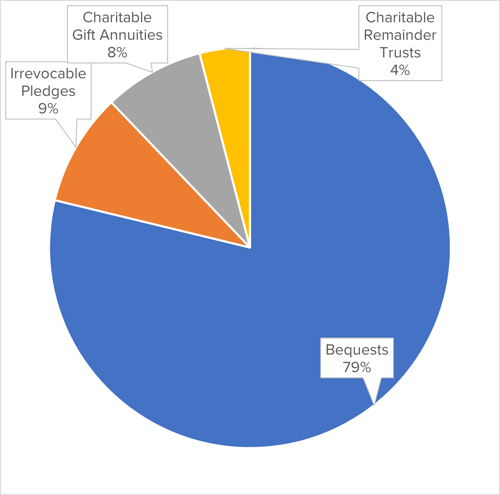
As with most charities, charitable bequests represent the vast majority of Fenway’s realized planned gifts. Despite the challenges of quantifying bequest expectancies, time and again experience shows that gifts from wills, living trusts, and beneficiary designations are the foundation of a successful planned giving program. This pattern holds regardless of size or industry. Revocable estate gifts are the cornerstone upon which successful planned giving programs are built.
Membership in a Legacy Society or other planned gift recognition program is a reliable indicator of the planned giving pipeline. But there’s more. Not only are revocable planned gifts lucrative, but research conducted by the Giving USA Foundation suggests that that Legacy Society membership increases the average bequest amount. Even though the research indicates that a significant number of bequest donors will not notify the charity in advance, building Legacy Society membership feeds the pipeline of future revocable intentions, grows the amount realized from estate gifts, and provides motivation to others, some of whom choose not to reveal their plans.
“Past History Is Not Predictive of Future Results” – Or Is It?
The Fenway School of Psychology illustrates two important challenges in predicting planned giving performance. First, from year to year the amount of realized estate gifts can vary widely. Much of this variability depends simply on mortality; who dies in what year. Second, past performance may not predict future results, even if the data show an increasing amount of revenue from realized planned gifts each year. Over the past 20 years, the Fenway School’s linear trend line shows a positive trajectory, yet the past five years have been downward.
Projections can be refined, given enough time and effort. For example, if life expectancy can be estimated, then you could develop a projection of planned gift potential in the future. Even if exact birthdates are not available, proxy data, such as class year, can used. Other evaluations of historical data, for example, the ratio of previously known expectancies to unexpected realized planned gifts and the actual versus expected value of known expectancies, can help develop more precise projections. Benchmarking to peer institutions or comparisons to industry experience can help you understand whether your organization is reaching its full potential.
Finally, a good measure of planned giving performance is the ratio of cash raised from realized planned gifts compared to cash raised from all other sources. Research conducted by Dr. Russell James at Texas Tech University found that the potential pool of those who might consider a planned gift is about 10% of a charity’s total constituency. This suggests that a mature planned giving program might be expected to account for 10% or more of the cash received each year.
The key question is how to evaluate the cost effectiveness of past efforts to encourage new expectancies, identify existing expectancies, and market planned gifts. Correlating past changes in program initiatives – or the suspension of efforts – can help infer conclusions about the value of those efforts. The experience of our clients is that the leverage of giving through the estate compared with lifetime giving is significant, provided consistent effort is applied over time. For example, a client with a robust planned giving program was raising $30 million to $40 million annually. A multi-year survey of realized planned gifts revealed that average lifetime giving from estate gift donors was $20,280, and the average estate gift from the same pool of donors was $435,992. The average estate gift was an astonishing 2,050% larger than lifetime giving from those donors. Compared to the cost of annual giving and major gift programs, the return on investment for planned giving is substantial.
Conclusion
Planned giving, by its very nature, is a long play, filled with subtleties and variations. The history of realized planned gifts can create expectations, but the annual total fluctuates unpredictably, depending on when donors die and the size of their gifts. Accurate forecasts are difficult, but historical analysis of realized planned gifts can identify patterns and establish a baseline of metrics to help manage organizational expectations. The case for planned giving is a long-term investment, one that pays off over decades, although not necessarily from one fiscal year to the next. Understanding the patterns and metrics of planned gifts can help manage expectations when the inevitable slump – or windfall – year comes your way.
Submit a Comment