2012 IAR: A New Kind of Mortality Table
Several states, including New York and Washington, have begun requiring the use of a new mortality table for determining the minimum reserves required for gift annuities issued on or after January 1, 2015. PG Calc recently added this new table, 2012 IAR, to Planned Giving Manager (PGM) and GiftWrap, so now is a good time to learn more about this new mortality table and how it differs from all the ones that have come before it.
First, a little history. In the states that require it, 2012 IAR replaces the Annuity 2000 mortality table. Annuity 2000 was based on projected mortalities for commercial annuity owners as of the year 2000. Due to medical and technological advances, however, life expectancies have increased since then (and likely will continue to do so). As a result, Annuity 2000 has increasingly under-predicted longevities and therefore led to under-reserved life annuities.
To address this problem, the National Association of Insurance Commissioners (NAIC) had a team of actuaries produce a new annuity valuation mortality table that would not become dated so quickly. The result is 2012 IAR. The table was adopted by the NAIC in December 2012 and since then by several states that regulate charitable gift annuities. In those states, the table applies only to the minimum reserves required for annuity contracts issued on or after January 1, 2015.
What makes 2012 IAR different?
The 2012 IAR table addresses Annuity 2000’s obsolescence in two ways. First, 2012 IAR is derived from more recent data: the mortality experience of commercial annuity owners from 2000 to 2004. Second – and this is what makes 2012 IAR different from all the annuity reserve valuation mortality tables that have come before - it is a generational table. This means that projected mortality improvements are incorporated into the table every year.
As the years advance, 2012 IAR will project ever greater longevities and, all else being the same, ever greater reserve requirements. The minimum reserve amount for a $1,000 annuity payable to a 75-year-old male, for example, will be lower in 2015 than the minimum reserve amount for an identical annuity in 2020. All of the previous annuity reserve valuation mortality tables were static tables that projected the same reserve amounts for a given age regardless of the year of valuation.
What difference does the new table make?
Although mandated only for computing the reserve requirement for new gift annuities in selected states, we have implemented 2012 IAR in GiftWrap and PGM. A few comparisons will illustrate how much results based on 2012 IAR differ from results based on other mortality tables.
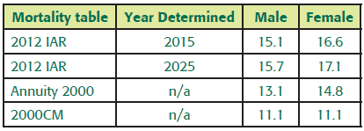
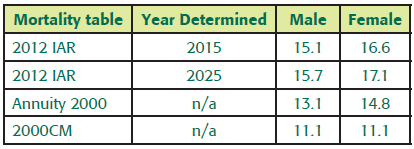
The table below shows the life expectancy of a 75-year-old computed using three different mortality tables. You can see that the gender and year of determination both matter when using 2012 IAR, only gender matters when using Annuity 2000, and neither matters when using 2000CM (the mortality table used to compute deductions for life income gifts). What’s more, the life expectancies based on 2012 IAR are substantially longer than those based on Annuity 2000, and especially 2000CM.
Life Expectancies for a 75-Year-Old
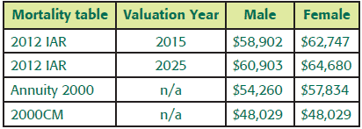
A similar pattern holds for annuity reserves computed for a $100,000 5.7% gift annuity with a 75-year-old annuitant: the greatest reserve amount is computed for a female in 2025 using 2012 IAR.
Annuity Reserves (4.5% Interest Rate)
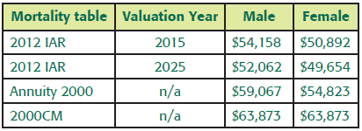
As you would expect, the opposite pattern holds when you compute the present value of a future $100,000 bequest promised by a 75-year-old (discounted at 4.5% annually): the lowest present value is computed for a female in 2025 using 2012 IAR.
Present Value of a Future $100,000 Bequest

Should you start using 2012 IAR?
When you produce a Gift Annuity Reserves report in GiftWrap, 2012 IAR is applied automatically whenever a state requires it. Consider also using 2012 IAR to compute life expectancies and bequest present values in PGM. Your results, though still estimates, will be more realistic and could facilitate better decision-making.
For a full view of the assumptions, data and processes used to develop the 2012 IAR mortality table, read the report from the National Association of Insurance Commissioners.
PG Calc can prepare the reserve reports you need in order to satisfy any state’s requirements. Click here to request more information on our State Reserve Report Service.


Submit a Comment