
 Annuity 2000. 2012 IAR. 1983 Basic. 2000CM. Perhaps you are familiar with one or more of these terms. They are the names of mortality tables that are important to planned giving calculations of one kind or another. With so many different mortality tables in play, it’s no wonder that gift planners get confused about which table is used for what purpose and why . . . to the extent that they think about them at all.
To help dispel the confusion, I briefly describe below what a mortality table is and the specific use and characteristics of the four mortality tables that gift planners need to be most aware of.
What is a mortality table, anyway?
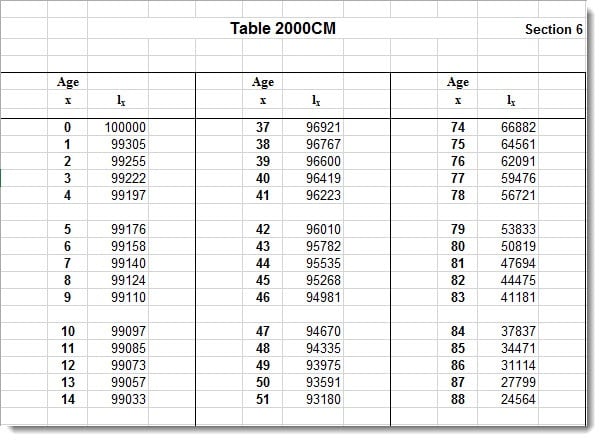
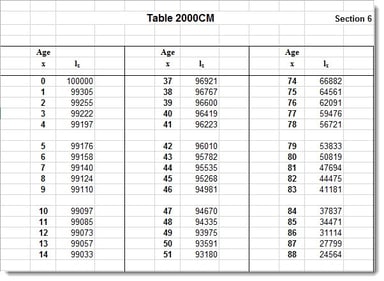
A mortality table shows how many people out of an original population will live to each subsequent age. For example, the 2000CM mortality table starts with a population of 100,000 at age 0, then shows how many of that original 100,000 will be alive at each subsequent age through 110, at which point the table predicts 0 survivors will remain. The other mortality tables mentioned above are constructed similarly, although the values they contain differ.
You can use the values in a mortality table to determine the probability that someone of a specific age will live to any greater age. For example, 2000 CM predicts that 74,794 of the original 100,000 will be alive at age 70 and 64,561 at age 75. This means that it predicts that someone who is 70 has a 64,561 / 74,794, or 86% probability of living to 75. In this way, a mortality table can be used to predict the likelihood that a beneficiary will live to receive future payments from a life income plan, such as a gift annuity or charitable remainder trust. It can also be used to determine a person’s life expectancy given the person’s current age.
2000CM mortality table
The 2000CM mortality table is based on the 2000 U.S. Census and is used to compute the federal tax deduction available to donors of life income plans and other split-interest gifts. It is a unisex, or gender-neutral, table that predicts the same mortality for men and women. It does this because the Supreme Court ruled in Arizona Governing Committee v. Norris (1983) that Arizona’s retirement plan, which made lower monthly payments to women than men because of their differing mortality rates, discriminated on the basis of gender. By law, this table must be updated no less often than every ten years. The next update is due by May 1, 2019 and will be based on the 2010 U.S. Census.
1983 Basic mortality table
The 1983 Basic mortality is used to compute how long part of a gift annuity’s distributions will be tax-free and, where applicable, how long part will be capital gain. It is another federal, and therefore unisex, table. Although arguably out-of-date, we must use it because the Treasury Regulation that contains the tables to use for this purpose hasn’t been updated since 1986 (Treas. Reg. 1.72-9).
Annuity 2000 mortality table
For states that require charities to maintain a minimum gift annuity reserve, the Annuity 2000 mortality table was used to compute state reserve requirements for gift annuities issued between roughly 1998 and 2015 (the effective dates vary somewhat from state to state). Unlike the mortality tables just discussed, Annuity 2000 is not a federal table. It was developed for the National Association of Insurance Commissioners based on the mortality experience of owners of commercial annuities, a much better proxy for gift annuity donors than the U.S. Census. Since it is not a federal table, it doesn’t have to be gender-neutral, and so it isn’t: it predicts lower mortality for women than for men.
2012 IAR
Since 2015, the 2012 IAR mortality table has been adopted by all the regulating states to replace Annuity 2000 for valuing gift annuity reserve requirements for new gift annuities. Annuity 2000 can still be used for determining the reserve required for gift annuities funded before then.
Like Annuity 2000, 2012 IAR is a gender-biased table, but it is based on more recent mortality experience of commercial annuity owners. In addition, it incorporates a yearly adjustment factor to account for anticipated future improvements in mortality. This means that at any given age, the table will predict a lower mortality (i.e., greater longevity) next year than it will this year.
Of all the mortality tables discussed, 2012 IAR predicts the lowest mortality, followed by Annuity 2000, 1983 Basic, and 2000CM.
Submit a Comment